


The methods section explains how the study was conducted. It sits after the literature review and covers four things:
- participants (who were studied and how they were selected);
- apparatus or materials (tools and instruments used);
- procedure (step-by-step description of what happened);
- data analysis (how results were processed).
Remember to write the text in the past tense and third person. Be specific enough that another researcher could replicate your study.
This guide shows how to write the methods section of a research paper. It explains the structure and key components. It explains best practices for describing your methods clearly and keeping your study easy to replicate.
What Is the Methods Section of a Research Paper?
This section explains how your study was carried out. It tells you what you did from beginning to end. Readers learn about the data you gathered, the participants you chose, and how you analyzed your results.
The goal is simple: give enough detail so that someone else can repeat the study and compare the findings.
Think of this section as a recipe — a recipe lists every ingredient and every step. If something is missing, the final result may be different. Some students turn to a custom research paper writing service to get this part right from the start. The same idea applies here.
A clear methods section helps other researchers repeat your work as accurately as possible.
A strong methods section also helps readers understand your decisions. It explains the rationale behind your choice of a particular design or data collection method.
It indicates that your method is suitable for your question. As a result, this lets the reader judge whether your methods were appropriate.
There are several reasons why the methodology of a study is important:
- Supports replication. Other researchers should have enough information to reproduce your study with the same methods.
- Builds trust. Clear explanations make your work more transparent and credible.
- Shows reliability. A detailed procedure demonstrates that a consistent approach was used in your study.
- Explains your choices. Readers understand why you chose certain methods over others.
- Shows quality. A well-written methods section shows that your study was carefully planned and conducted.
A good methods section does more than describe what happened. It gives readers confidence in your work. When the process is clear, others can evaluate, repeat, and build on your findings.
Methodology vs. Methods
Many students use the terms “methods” and “methodology” interchangeably. They are related, but they mean DIFFERENT things.
Methodologies are usually divided into two main types.
Qualitative methodology is concerned with experience, opinion, and behavior. It works with non-numeric data. The common methods are interviews, focus groups, observations, and thematic analysis.
Example:
Exploring how students feel about online learning through interviews.
Quantitative methodology is the measurement and comparison of data. It’s about numbers and statistical analysis. The usual methods are surveys, experiments, and statistical tests.
Example:
Comparing exam scores from 300 students using a survey and statistical analysis.
Here is a quick comparison of methodology and methods:
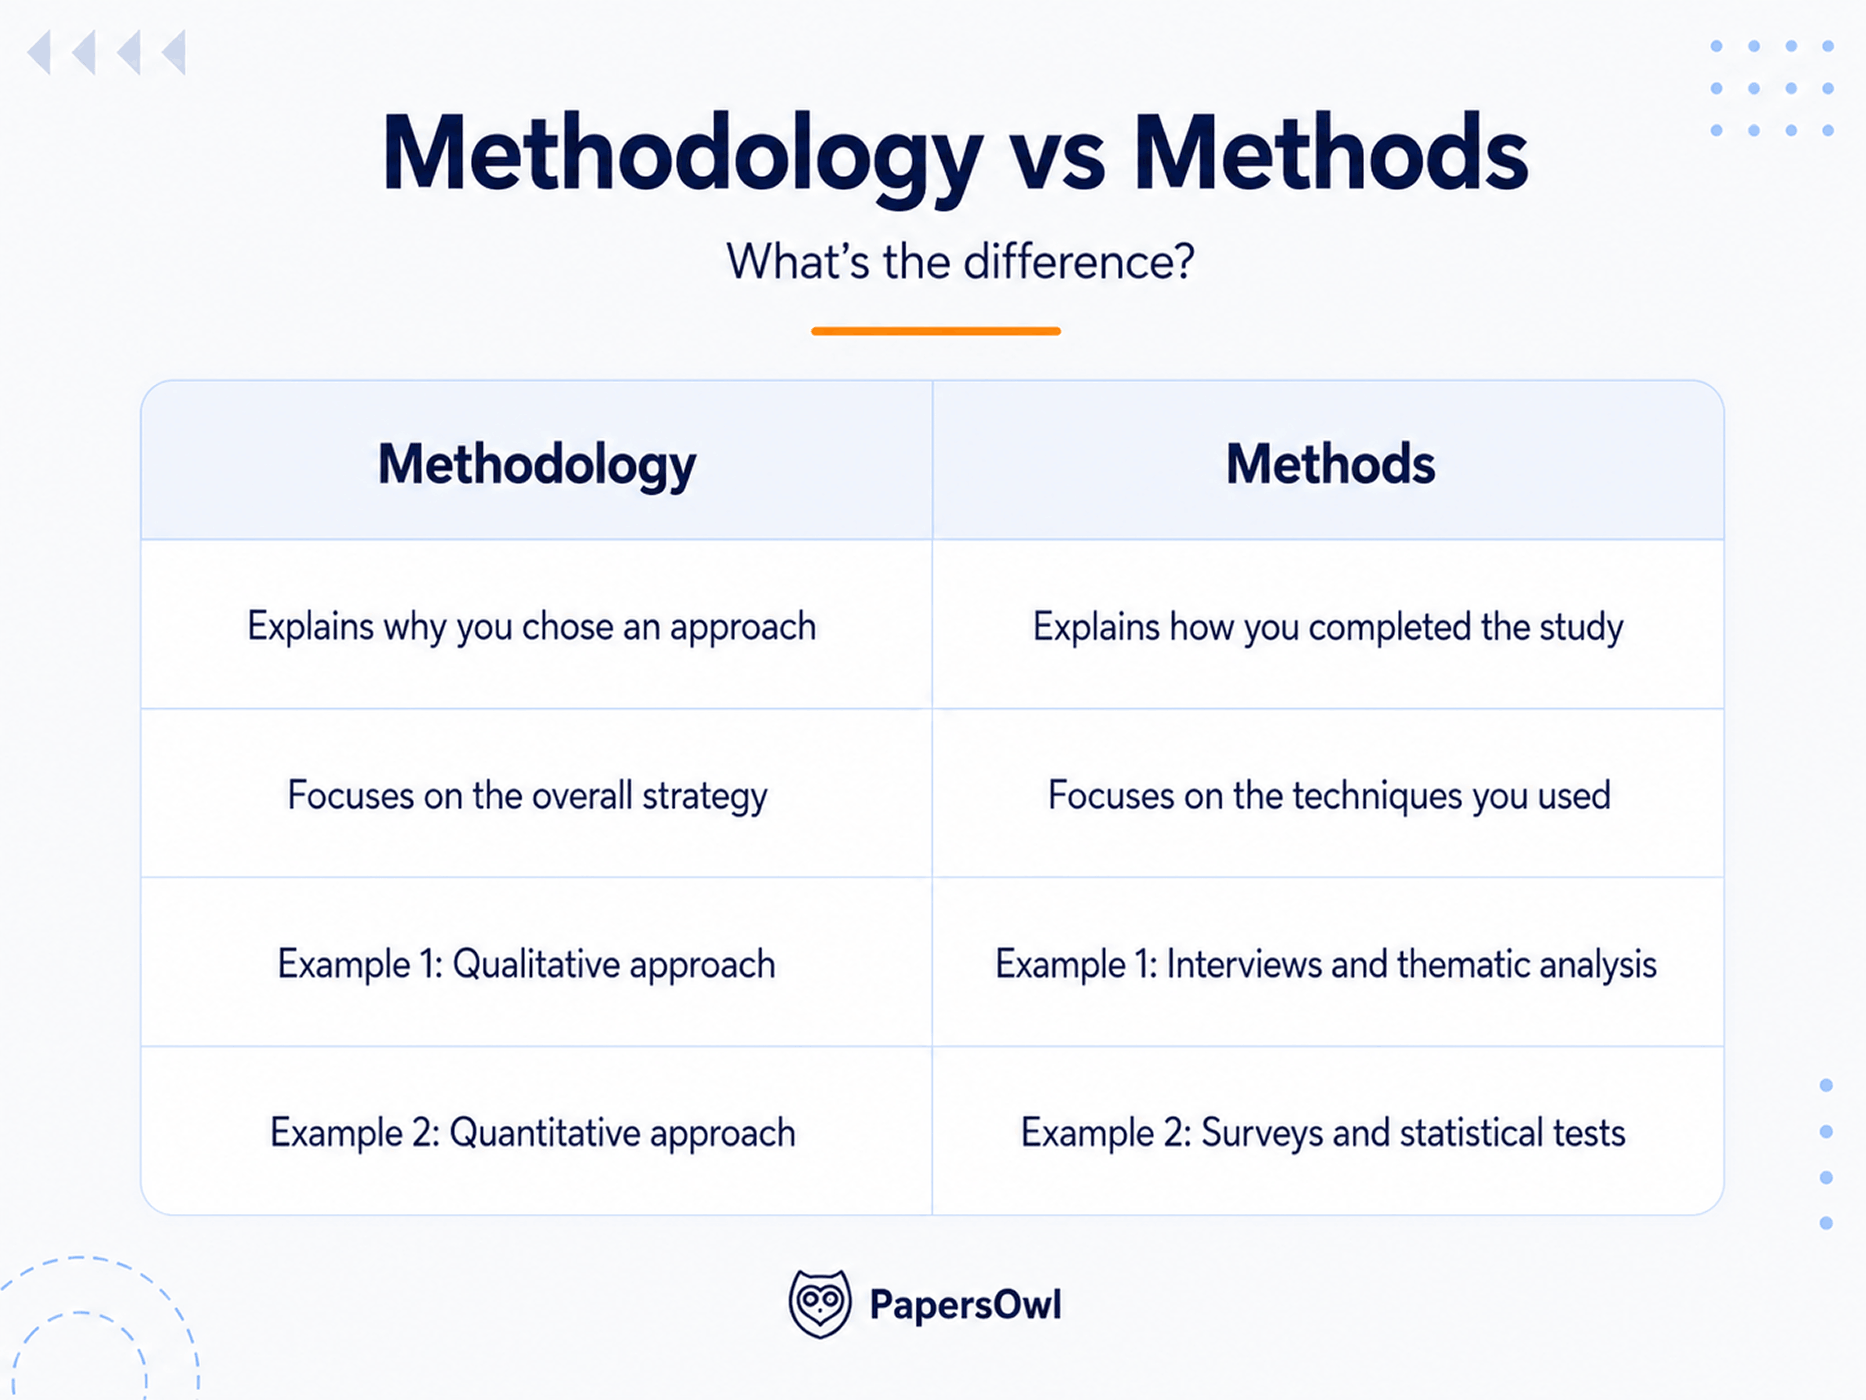
One simple way to keep the difference in mind is that methodology is the big picture, and methods are the practical steps.
For this reason, most research papers devote more space to describing the methods, as readers need sufficient detail to understand and replicate the study.
Structure of the Methodology in a Research Paper
A clear methodology helps the reader know exactly how you conducted your study. It guides them through every step, from planning to data analysis. It also makes it easier to assess and copy your work.
If you’ve read any example of methodology in research paper, you’ve likely seen the information presented in a logical order. The whole process is easy to follow because each part builds on the previous one.
Research summary
Start the methods section with a brief overview of the research design and the main methods used.
First, introduce the study in a few sentences and identify the type of research you conducted.
Example:
This study used a qualitative case study to investigate students’ experiences or a quantitative survey to assess study habits.
Then, briefly explain how you collected and analyzed the data. Together, these details will give readers a clear summary of the methodology before they move on to the individual steps.
Example:
“The study employed a quantitative survey design. Data were collected using an online questionnaire completed by 250 university students. The responses were analyzed using descriptive statistics and regression analysis.”
This summary serves as a heads-up to your readers about your approach before they go into the details.
Scientific methods
In the materials and methods section, describe the materials, tools, and equipment used during the study. Provide enough information so that someone else could follow the same process.
If laboratory equipment was used, provide the model number and manufacturer, if available.
Examples:
- Olympus CX23 microscope (Olympus Corporation, Japan).
- Ohaus Pioneer PX224 digital scale (Ohaus Corporation, USA).
- SPSS Statistics Version 29 (IBM Corp.) for data analysis.
If surveys or interviews were part of your study, describe them briefly. Mention whether you created the questionnaire yourself or used an existing one.
Step-by-step description
Provide a detailed description of the steps taken to conduct the study so that it can be replicated.
Explain the process in the same order it happened. This helps readers visualize the entire process.
Examples:
- Participants received an invitation.
- They signed a consent form.
- They completed an online survey.
- The responses were checked for missing data.
- The data were analyzed.
An interview study would follow different steps.
Examples:
- Participants were recruited.
- Interviews were scheduled.
- Each interview lasted about 45 minutes.
- The recordings were transcribed.
- The responses were grouped into common themes.
Keep the explanation complete but straightforward.
Analyzing data
Outline the data analysis methods and software used. Add any relevant ethical considerations.
After gathering the data, tell readers what you did with it. Your analysis should be the same type of information that you collected.
State the statistical tests that you used for the numerical data. They may also include t-tests, ANOVA, chi-square tests, and regression analysis. Also mention software such as SPSS, R, Stata, SAS, or Excel.
Explain how you identified patterns in interview or observation studies. Many qualitative studies employ thematic analysis or content analysis.
The project’s methodology complements
Explain how the methodology addresses study limitations and potential biases to ensure integrity.
Briefly describe anything that may have affected your findings:
- You may have worked with a small sample.
- You may have collected data from only one location.
- Some participants may have answered the survey questions differently from what we expected.
It also helps clarify how you accounted for bias. You might have used random sampling, the same instructions for all participants, or a standardized questionnaire.
To sum up, in this brief discussion, you will demonstrate to your readers that you have carefully designed your study. It also helps them better understand and assess your findings.
Organize your research
A well-organized method section is easier to read through and comprehend. People should be able to find what they want to know quickly, not sifting through long paragraphs.
If you are writing in APA style, remember to organize this section with clear subheadings to separate each part of the section. Common headings are Research Design, Participants, Materials, Procedure, Data Analysis, and Ethical Considerations.
Not all studies require all headings. Choose the ones that apply to your project. It can also be helpful to read an example of a methods section in a research paper to see these elements in action.
Participants
Begin by presenting the people involved in your study. Describe who they were, the number of participants you registered, and why they were appropriate for your study.
Readers need to be clear about who exactly your findings apply to.
Characteristics
Describe the participants in enough detail for readers to understand your sample. Include only information that matters to your study.
These characteristics may include:
- Age;
- Sex;
- Ethnicity (if applicable);
- Occupation / Work;
- Education level;
- Location (geographical).
Example:
“Fifty female undergraduate students between 19 and 23 participated in the experiment. All were sophomores in the Faculty of Engineering and native English speakers who lived on the university campus. The participants were separated into two groups of 25 students, with no predetermined criteria. This study was conducted at the University of Alabama, USA.”
Sampling strategy
Then describe how you selected your participants. This will tell readers whether your sample is representative of the larger population.
The most common sampling methods are:
- Random sampling — Every person has an equal chance of being selected; all are eligible.
- Convenience sampling — Participants are selected because they are readily available.
- Stratified sampling — Participants are chosen from different groups to achieve balance.
- Purposive sampling — Participants are selected because they have certain knowledge or experience.
Also, explain whether participation was voluntary. If participants received compensation, mention it.
Example:
“Participation was voluntary. Students were given a small gift card for completing the survey.”
Sample size
Discuss the number of participants in the study and why this number was appropriate. In quantitative research, the sample size is often predetermined before data collection. This helps ensure the study is sufficiently powered to detect meaningful differences.
Example:
Power analysis could show that a sample size of at least 150 participants would be necessary to achieve 80% statistical power at the 0.05 significance level.
Provide a summary of any changes to your final sample due to withdrawals or incomplete responses.
Apparatus
List and describe the tools and instruments used to collect & measure the data. Be specific enough for another scientist to reproduce your experiment.
Where relevant, include the manufacturer and the equipment model number.
Examples:
- Garmin Forerunner 255 smartwatch (Garmin Ltd.) to record heart rate during exercise.
- Canon EOS 90D digital camera (Canon Inc., Japan) to document field observations.
- NVivo 14 (Lumivero) to organize and analyze interview transcripts.
- Qualtrics XM survey platform (Qualtrics LLC) to collect online questionnaire responses.
If you used questionnaires or standardized tests, identify them and describe briefly what they measured.
Examples:
- Perceived Stress Scale (PSS-10) to measure participants’ stress levels.
- Patient Health Questionnaire-9 (PHQ-9) to assess symptoms of depression.
- Big Five Inventory (BFI-44) to measure personality traits.
- System Usability Scale (SUS) to evaluate users’ experience with a website or application.
It is also useful to report reliability and validity. Reliability is how much a tool produces the same results over time. Validity refers to the tool’s ability to measure what it is intended to measure.
If available, include values such as Cronbach’s alpha or refer to previous validation studies to support your choice of instrument.
Procedure
Describe exactly how your study was completed. Write the steps in the same order they happened. The reader should be able to follow the process from start to finish.
Make sure to describe the study’s location, its duration, and what the participants had to do.
Examples:
- Participants received an invitation by email.
- They signed an informed consent form.
- They completed the questionnaire online.
- The responses were checked for missing data.
- The information was prepared for analysis.
If your study involved interviews or experiments, explain those steps just as clearly. Include any instructions you gave participants and describe the conditions during the study.
The goal is to provide sufficient information for another researcher to repeat the procedure with confidence.
Tips on How to Write a Methods Section
A methods section needs to be easy to read and easy to follow. Readers should be able to see what you did, without having to guess. They should also see why your approach was appropriate for your study.
Here are some quick recommendations for a concise and meticulously written methodology:
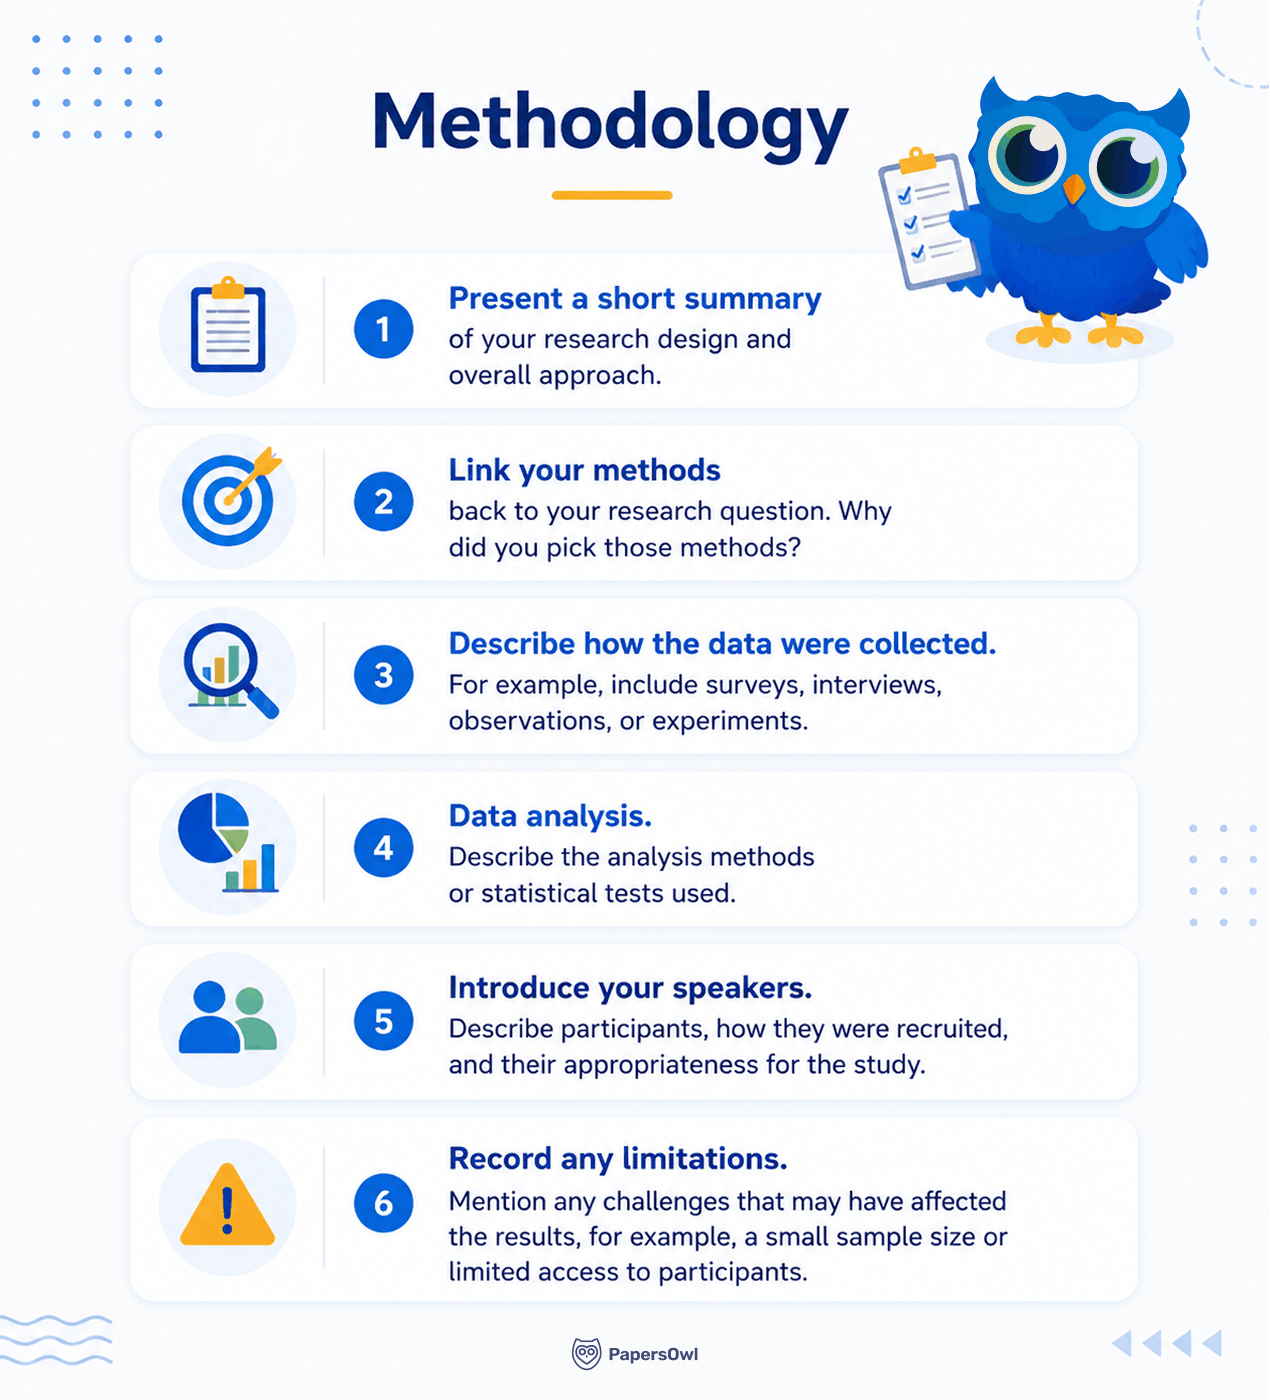
Read the entire section, from beginning to end, then go on. Each move should transition fluidly to the next.
Your methods section is doing its job if readers can easily follow your process!
Tip 1: methods and results should match
Your methods and your results should always go together. Every result must have been obtained by a method already cited.
If readers see a result without a corresponding method, they may question your work.
Examples:
- In the methods section, describe how the survey was designed and administered if you are reporting the results of a survey.
- If you discuss interview themes, describe how you carried out the interviews and analyzed the responses.
- The same rule applies to experiments, observations, and statistical tests.
Keep both sections in the same order whenever possible. This makes your paper much easier to follow. Readers can move from one section to the next without searching for missing information.
For complex studies, a flowchart or timeline may also be useful. It gives readers a quick overview of the research process and how each step connects to the final results.
Before submitting your paper, compare the two sections. Check that every method has a related result, and every result comes from a method you explained clearly.
This simple review makes your study more consistent and easier to understand.
Tip 2: explain how you analyzed the data
The statistical analysis sub-section is usually located at the end of the methods section. It tells you what you did to the data once you had it. Readers want to know how you converted raw data into meaningful results.
Start by describing the type of data you analyzed. Then, explain the statistical methods you used and why they were the best choice for your study. List the name and version of the software you used.
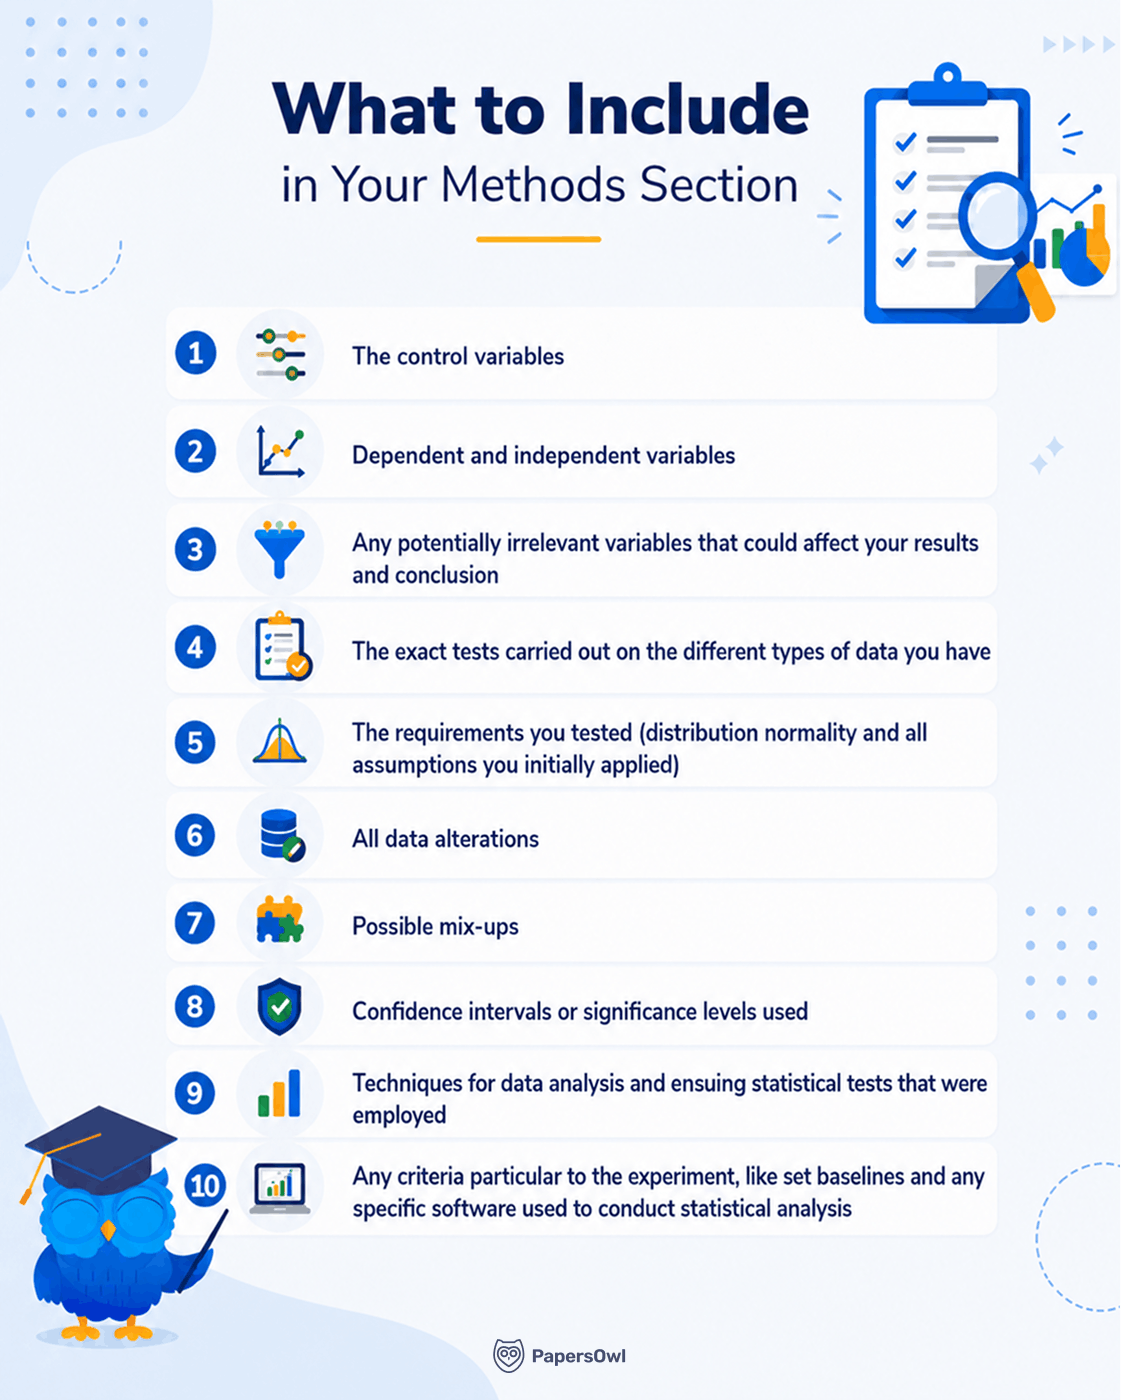
Make sure to include the important details such as:
- Variables — Describe the variables you studied. If your exploration had independent and dependent variables, please identify these.
- Statistical tests — List the tests you used and describe what they were used for. Examples: t-test to compare two groups, ANOVA to compare several groups, chi-square test for categorical data, or regression analysis to examine relationships.
- Significance level — Report the significance level you chose. Most studies use p < 0.05.
- Descriptive statistics — Describe how you summarized the data. Example: Means, percentages, standard deviations, or frequency tables.
- Software — Describe the software used in the analysis. Example: SPSS, R, Stata, SAS, or Microsoft Excel.
Keep this subsection factual and brief. Do not explain the results here. Save that discussion for the Results section.
The goal is to show how the data were analyzed so that another researcher could repeat the same process.
Tip 3: choose one writing style and use it consistently
As mentioned, the methodology explains how and why the experiment was conducted. It should give readers enough information to understand the process and replicate the procedure.
To make the section easy to follow, consider what your audience already knows. Explain any technical terms that may be unfamiliar.
Most academic style guides recommend writing the methods section in the third person. This creates a more formal and objective tone. Instead of focusing on yourself, focus on the study and the procedures.
Example:
You should use “We carried out a survey” and not “I carried out a survey.”
The passive voice is also common in methodology sections because it emphasizes the process instead of the researcher.
Examples:
- Passive voice: A survey was conducted among 200 students.
- Active voice: The researchers surveyed 200 students.
Both versions are acceptable in many disciplines today. However, the passive voice remains common because it keeps the focus on the research rather than on the person conducting it.
Finally, be specific. Instead of writing “Several participants completed the survey,” write “One hundred twenty participants completed the online survey.”
Small details make your methods section clearer and more trustworthy.
Quick Checklist for Your Methodology
Before you finish the methods section, check that you have included:
A complete methodology should allow readers to understand how the study was conducted and determine whether they could replicate it.
Get Extra Help With Your Methodology Chapter!
Writing the methodology section of research paper can take several revisions, even for experienced students. You can start by asking a classmate, professor, or mentor for feedback. They may notice unclear explanations or missing details.
Next, edit the section carefully. Make each step easy to follow, remove repeated ideas, shorten long sentences, and confirm that your methods match the research question.
When additional support is necessary, consider a reputable academic editing or writing service. Professional feedback may improve the clarity, structure, and formatting of your work. Before submission, always review the final version yourself to ensure that it accurately represents your research!