
Inferential statistics is critical for data analysis and scientific research because it allows us to analyze numerical data, make conclusions from samples, and foresee results. Consequently, we may investigate population data using this subset of statistical processes, including generated inferential statistics and findings. From healthcare to marketing, its applications are vast and varied in diverse investigations and research paper types.
Today’s guide seeks to provide a clear description of inferential statistics and investigate various types of inferential statistics, e.g., descriptive statistics, providing ways for understanding these important analytical methods, which include both parametric and nonparametric tests. It will also discuss the differences between descriptive statistics and inferential one to grasp all of the aspects of the topic.
Basics of Inferential Statistics
The inferential statistics definition is explained as the basis for data analysis. It enables us to forecast and draw conclusions about a broader population from a representative sample and a smaller data set. Thus understanding its fundamental concepts. The standard deviation and sampling error are crucial for any aspiring data analyst eager to investigate some research question based on inferential stats analysis.
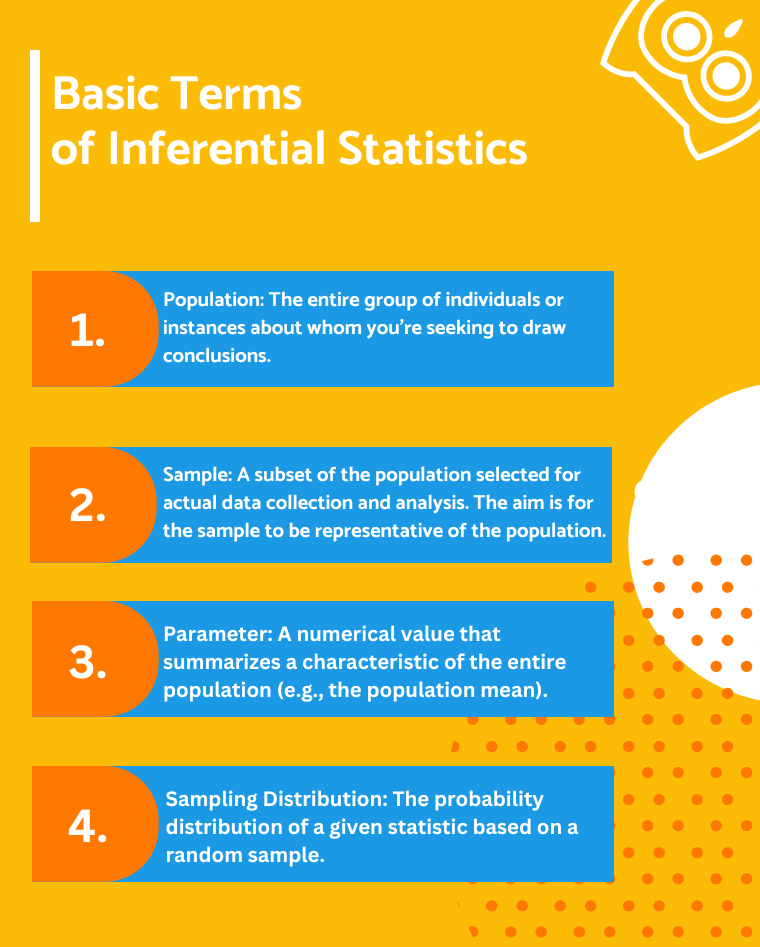
Population: The term population refers to the group as a whole that you are interested in investigating. It could be anything from the entire population of a country to all the clients of a specific company. In statistical analysis, it’s often impractical or impossible to get collected data from each member of a population based on its accessibility or size.
Sample: A sample is a population segment chosen for inferential statistics research. To guarantee valid findings, this sample should ideally be representative of the population. Sampling error and other aspects of the random sampling procedure are crucial and can greatly affect the validity of the conclusions.
Parameter: Next, we have a parameter, a numerical value describing a population characteristic. For example, the average age of all the people in a city is a parameter. Since obtaining the data from the whole population is not always feasible, we estimate parameters using statistical models.
Statistic: Lastly, a statistic is a characteristic of a sample. It serves as an interval estimate of the corresponding population parameter. For example, the average age of individuals in a city-wide sample is a statistic. It’s an important piece of collected data in inferential statistics as it allows us to infer the characteristics of a larger population from a smaller group.
Understanding these key terms is essential for investigating different kinds of inferential statistics and their methods, including parametric tests and descriptive statistics, which often require a regular distribution.
Differentiating Between Inferential and Descriptive Statistics
While both descriptive statistics and inferential statistics are integral to data analysis, they offer different purposes.
Descriptive statistics explains the features of the data, providing a detailed picture of its characteristics through measures like mean, median, variance, and standard deviation. Also, descriptive statistics do not involve making inferences or generalizations beyond the analyzed dataset.
Meanwhile, the second type uses sample data to conclude, create generalizations, or make predictions about a larger population. This involves using probability theory to estimate population parameters, test hypotheses, and make predictions.
Descriptive statistics primarily address the “what is” of the data, while inferential concentrates on the “what could be” and frequently yields statistically significant result. Descriptive statistics provide insights into the dataset’s characteristics, while inferential statistics allow researchers to generalize findings to the larger population.
Consequently, descriptive and inferential statistics are crucial but different types of this discipline. Thus, inferential and descriptive statistics thoroughly comprehend inferential data and conclusions.
Types of Inferential Statistics
Inferential statistics comprises a number of approaches, each with a unique application and relevance. They are commonly referred to as inferential statistics methods. Three common methods include hypothesis testing, confidence intervals, and regression analysis, each playing a pivotal role in statistical analysis.
Hypothesis Testing
This method uses statistical techniques to determine whether sample data validates a hypothesis. For instance, a researcher might use hypothesis testing to determine if a new medication has a different effect than a placebo. It often involves parametric tests like the z-test and computing a t critical value to accept or reject null hypothesis.
Confidence Intervals
It is a vital component of inferential statistical analysis. As a result, it provides a range of values within which the true population parameter will likely fall. This method is particularly useful in expressing the degree of uncertainty associated with sample statistics. For example, if, according to a survey, 60% of voters favor a certain candidate, with a confidence interval of ±4%. This suggests that the true proportion of voters in favor is likely between 56% and 64%. Indeed, this process can be intricate and may require research paper writing assistance to verify correctness and conformity to statistical standards.
Regression Analysis
This involves understanding relationships between variables, often using regression coefficients to predict one variable based on another. In business, regression analysis might be used to understand how changes in advertising budget impact sales revenue. It allows for the assessment of which factors matter most and how different variables interact with each other.
As described above, each method provides a unique lens through which we can analyze data, offering insightful knowledge in various fields, including scientific research and market analysis.
Understanding Hypothesis Testing
Hypothesis testing is an essential aspect of inferential statistics, providing a structured method for making decisions about a population based on sample data. The procedure may be separated into numerous important components.
Null and Alternative Hypotheses
The foundation of hypothesis testing in inferential statistics lies in formulating two contrasting hypotheses. The null hypothesis (denoted as H0) is a statement of no effect or difference, serving as the default assumption. For example, it could state that a new drug does not affect a disease compared to a placebo. In contrast, the alternative hypothesis (denoted as H1) suggests that there is an effect or a difference. Applying the same example, the alternative hypothesis would assert that the new drug does affect the disease.
Types of Errors
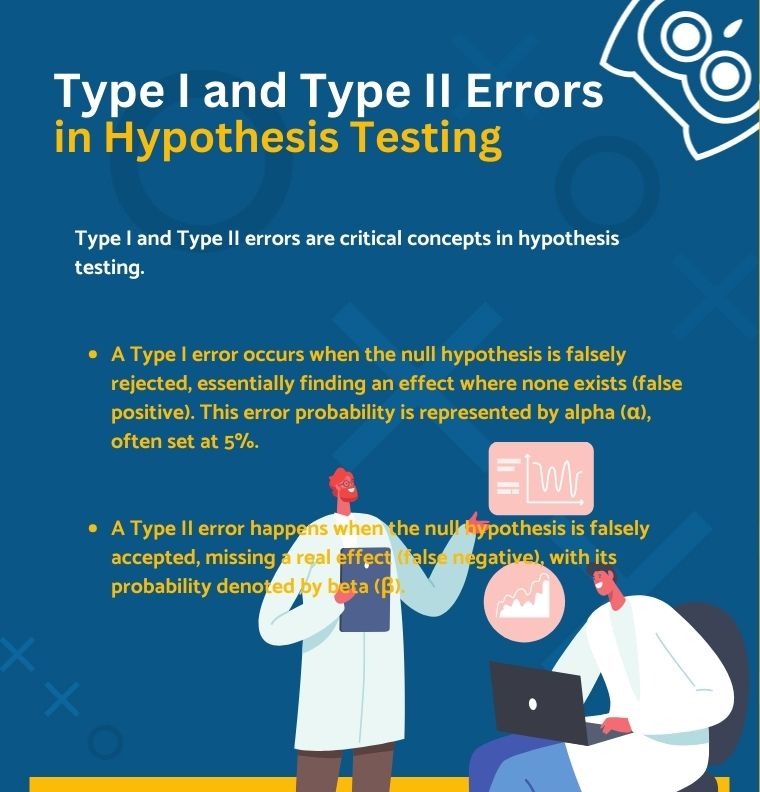
In hypothesis testing, there are two main types of errors to consider. A Type I error occurs when the null hypothesis is true but is incorrectly rejected. It’s akin to a false positive. On the other hand, a Type II error happens when the null hypothesis is false but is erroneously accepted, similar to a false negative. Balancing these errors is crucial in statistical analysis.
Step-by-Step Guide to a Basic Hypothesis Test
- Formulate the null and alternative hypotheses based on the research question to state the hypotheses.
- Choose a significance level, usually set as 0.05, meaning there is a 5% chance of making a Type I error.
- Select the appropriate statistical test, like a t-test or chi-square test, depending on the data type and distribution.
- Calculate the test statistic using sample data.
- Decide whether to reject the null hypothesis and compare the test statistic to the critical value or p-value.
Following these directions, hypothesis testing allows researchers to make informed decisions about the validity of their hypotheses based on statistical evidence. Afterward, writing research paper gets more straightforward after forming the core hypothesis and suitably putting it to the examination.
Dealing With Confidence Intervals
Confidence intervals (CIs) are fundamental in inferential statistics, filling the gaps between sample data and population parameters. They provide a variety of numbers within which a population parameter lies.
Defining Confidence Intervals
A confidence interval offers an estimated range of values likely to incorporate an unknown population parameter. It is computed from sample data and expressed with a certain level of confidence. Typically, this confidence level is set at 95%, though other levels like 90% or 99% can also be used depending on the research requirements.
Calculating Confidence Intervals
There are several processes for calculating a confidence interval:
- Determine the sample statistic by calculating the mean or proportion from the sample data.
- Select the confidence level (e.g., 95%) you wish to have in estimating the interval.
- Find the standard mistake of the statistic and then use a z-score or t-score (depending on sample size and whether population standard deviation is known) to calculate the error margin.
- Compute the confidence interval’s lower and upper limits, and add and subtract the margin of error from the sample statistic.
Interpreting Confidence Intervals
Interpreting CIs requires understanding what the confidence level means. For example, a 95% confidence interval implies that if we gather 100 separate samples and generate a confidence interval for each sample, we would anticipate about 95 intervals to contain the actual population parameter estimate. It is crucial to remember that the confidence interval does not indicate the likelihood that the parameter will fall inside the range; rather, it reflects the reliability of the estimation process.
Confidence intervals are useful in inferential statistics because they evaluate the precision of the estimated value and provide a range for where the parameter’s real value may fall, providing a more complex perspective than a one-point approximation.
Explaining Regression Analysis
Regression analysis is a strong statistical tool used for modeling and analyzing the relationship through variables. Linear regression is one of the most often used inferential statistics approaches.
Introduction to Linear Regression
Linear regression is a method to predict the linear relationship between a dependent variable (outcome variable) and one or more independent variables. It makes the assumption, which implies that there is a linear connection between these variables. Its simplest possible version, simple linear regression models the relationship between two variables – one independent variable (predictor) and one dependent variable (outcome).
Relationship Between Variables in Linear Regression
The core idea of linear regression is to fit a straight line (or a ‘regression line’) through the data points to minimize the differences between the observed values and the values predicted by the line. The equation represents this line:

Here, Y represents the dependent variable, X the independent variable, a the y-intercept (the value of Y when X is 0), and b is the slope of the line, which shows the change in Y for a one-unit change in X.
Significance of Regression Analysis
This analysis helps predict values and understand the strength and direction of the relationship between variables. A positive slope b indicates a positive relationship (as X increases, Y increases), while a negative slope indicates a negative relationship (as X increases, Y decreases).
Generally speaking, linear regression is pivotal in fields like economics, business, engineering, and the social sciences, because it is important for decision-making for the understanding and quantifying relationships between variables.
Common Statistical Tests
Statistical tests are essential tools in data analysis, each designed for specific situations and data types. Among the most commonly used are the t-test, chi-square test, and ANOVA. Understanding when and how to use these tests is crucial in statistical analysis.
T-test
The t-test is used to compare the means of two groups to see if they are significantly different from each other. It comes in three varieties:
- Independent Samples t-test: Compares means between two independent groups (e.g., comparing students’ test scores from two different schools).
- Paired Samples t-test: Compares the means of the same group at various times (for example, before and after therapy in medical research).
- One Sample t-test: Tests the mean of a single group against a known mean (e.g., comparing the average performance of a machine against the industry norm).
Chi-Square Test
This test is used primarily for categorical data in inferential statistics. The Chi-Square Test is the most popular kind of Independence, which assesses whether there is an association between two categorical variables. For instance, it can be applied if there is a relationship between gender and voting preference.
ANOVA (Analysis of Variance)
ANOVA compares the means among two or more groups. It tests the hypothesis that the means of several groups are equal. This test is particularly useful in experiments involving multiple groups and control variables. For instance, an ANOVA might be used to assess the efficacy of various teaching strategies in loads of classes.
Each test makes some assumptions about the data, such as its distribution and variance characteristics. They must be fulfilled for the findings to be considered legitimate. Choosing the right test and correctly interpreting its results is essential for making sound research and data analysis conclusions.
Practical Applications of Inferential Statistics
Inferential statistics is critical in various fields, providing insights and guiding decision-making through data analysis. Here is an example of inferential statistics in different areas:
Healthcare: Drug Efficacy Studies
In healthcare, it is used in drug efficacy studies. For instance, it enables researchers to assess whether a new drug significantly improves patient outcomes compared to a placebo, influencing drug approval and treatment approaches.
Business: Market Research
In business, such type of statistics is applied in market research to infer broader trends from a data set. Accordingly, companies can infer broader market trends by analyzing customer samples guiding marketing and product development strategies.
Psychology: Behavioral Studies
In psychology, inductive statistics helps in understanding human behavior through inferential study. Psychologists can utilize sample data to estimate the effects of numerous factors, such as social media use, on mental health, therefore changing treatment approaches.
Environmental Science: Climate Change Research
In environmental science, it analyzes climate data, helping scientists make inferences about global climate trends and informing climate change mitigation strategies.
These examples of inferential statistics highlight the role of inferential statistics in extracting meaningful conclusions from sample data across diverse fields, from healthcare to environmental science. Importantly, inferential statistics in nursing research and other statistical inference real life example from different fields often involve using statistical models to describe data and draw conclusions. This can involve everything from z test to assessing P value and regression coefficients.
5 Tips for Mastering Inferential Statistics
Grasping this type of statistics requires theoretical understanding and practical application. Here are some strategies and resources to help you master inferential statistics in research:
- Begin with a thorough understanding of the fundamentals, such as probability, distribution, and hypothesis testing. Use textbooks or online courses for structured learning of the topic.
- Apply concepts to real-world data sets. Websites like Kaggle or the UCI Machine Learning Repository offer diverse data for practice.
- Platforms like Khan Academy, Coursera, or MIT OpenCourseWare provide free courses and tutorials. Interactive tools like R or Python notebooks also offer hands-on experience to enhance understanding of statistical models, normal distribution, standard deviation, and critical value calculations.
- Regularly solving statistical problems enhances understanding. Thus, try inferential statistics exercises from academic textbooks or online problem sets.
- Engaging with peers or online communities, like Reddit’s r/statistics or Stack Exchange, can provide support and diverse perspectives.
As you can see, mastering inferential statistics, a cornerstone of data analysis, requires dedication and strategic study. Thus, remember that comprehension of inferential statistics requires constant practice and application to real-world problems.
Summing Up
Inferential statistics is a powerful tool for researchers and analysts across various disciplines, from hypothesis testing to estimating parameters. Understanding its concepts and methods allows one to interpret sample data effectively to make informed predictions about larger populations. Additionally, the purpose of inferential statistics is to offer a way to draw conclusions from a data set, making it indispensable in research and data analysis. Whether you’re a student, a professional, or just a curious learner, this guide provides a solid foundation for exploring the fascinating world of inferential statistics and harnessing its potential to uncover insights hidden within data.
For those seeking in-depth analysis and interpretation of data, enlisting the help of professional online essay writer to deal with the intricacies of inferential statistics can be beneficial.